Integrate Network Watcher with Load Balancer Diagnostics
Integrate Network Watcher with Load Balancer Diagnostics to enhance performance monitoring and troubleshoot cloud infrastructure efficiently.
Azure's Network Watcher and Load Balancer Diagnostics are key tools for monitoring and troubleshooting cloud infrastructure. By integrating these tools, you can track network performance, identify issues, and ensure reliable operations - all while managing costs effectively. Here's what you need to know:
- Network Watcher offers tools like IP Flow Verify, Packet Capture, and Connection Troubleshoot to monitor and diagnose network traffic, latency, and connectivity issues.
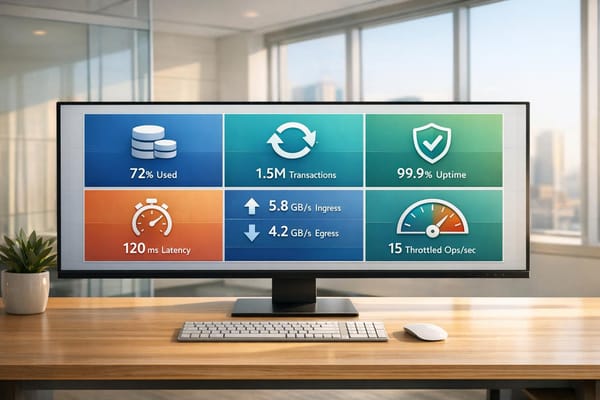
- Load Balancer Diagnostics provides real-time metrics like Data Path Availability, Health Probe Status, and SNAT Connection Count to evaluate load balancer health and traffic distribution.
- Integration improves performance monitoring, security, and troubleshooting, helping small and medium-sized businesses (SMBs) maintain smooth operations on Azure.
Key Steps for Integration:
- Enable Network Watcher in the relevant Azure region.
- Configure Load Balancer Diagnostic Settings to track essential metrics and route logs to a Log Analytics Workspace, Storage Account, or Event Hub.
- Verify permissions and ensure compatibility with Standard Load Balancer for advanced metrics.
- Use tools like Traffic Analytics, Connection Monitor, and Virtual Network Flow Logs for detailed insights.
Benefits for SMBs:
- Early issue detection with alerts for low Data Path Availability or SNAT port exhaustion.
- Cost control by focusing on essential metrics and optimising configurations.
- Enhanced visibility into network traffic and application performance.
By combining these tools, SMBs can streamline Azure monitoring, improve reliability, and manage resources efficiently.
Complete Azure Network Watcher DEMO and Overview
Prerequisites for Integration
Before starting the integration process, it's essential to meet a few prerequisites. These steps will help you avoid common configuration issues later on.
Azure Account and Permissions Setup
Your Azure account must hold either the Owner, Contributor, or Network Contributor roles. Keep in mind, though, that the Network Contributor role alone may not suffice as it lacks certain permissions for Storage, Compute, Operational Insights, and Insights.
To ensure seamless integration, your account should have the following permissions:
| Service Area | Required Actions | Purpose |
|---|---|---|
| Network Watcher | Microsoft.Network/networkWatchers/read, write, delete | Create and manage Network Watcher instances |
| Flow Logs | Microsoft.Network/networkWatchers/flowLogs/read, write, delete | Configure and manage traffic flow logging |
| Load Balancer | Microsoft.Network/loadBalancers/read | Access load balancer definitions and metrics |
| Storage Access | Microsoft.Storage/storageAccounts/listServiceSas/Action | Enable secure access to storage accounts |
To verify your role assignments, head to Subscriptions > Access control (IAM) in the Azure portal. If you encounter restrictions, reach out to your administrator for assistance.
A critical note: when enabling traffic analytics, permissions inherited from a management group won't work. You'll need direct subscription-level permissions for this feature.
Once permissions are in place, double-check your Load Balancer and Network Watcher settings to ensure they align with your requirements.
Checking System Compatibility
For full diagnostic functionality, a Standard Load Balancer is required. The Basic Load Balancer does not support multi-dimensional metrics, which are vital for advanced monitoring.
Additionally, confirm that Network Watcher is enabled in the Azure region where your Load Balancer operates. Each region requires its own Network Watcher instance per subscription for effective monitoring.
Pay special attention to health probe configuration. Ensure the health probes are set to a port that is actively listening and responding with the correct protocol. If you're using direct server return or floating IP rules, verify that your service listens on both the IP address from the NIC's configuration and the loopback configured with the frontend IP address.
"The Health Probe Status metric describes the health of your application deployment as configured by you when you configure the health probe of your load balancer." (Manage Azure Load Balancer Health Status, 2024)
Be aware that Network Security Groups (NSGs), your VM's guest OS firewall, or application-level filters can block health probe traffic. Furthermore, the Data Path Availability metric will only provide data for frontend IP configurations that have load balancing rules.
Once these compatibility checks are complete, you can move on to setting up your environment.
Environment Setup Steps
Start by enabling Network Watcher in your desired Azure region. Navigate to Network Watcher in the Azure portal and confirm it is active for your subscription in the regions where your Load Balancer operates.
Next, verify that your Load Balancer's diagnostic settings are ready. In October 2024, Azure introduced the Health Status feature, which offers detailed health insights about backend instances in your backend pool. This feature identifies whether backend instances are up or down, along with reason codes categorised as User Triggered or Platform Triggered events. You can access this information via the Azure portal or through the REST API, based on specific load balancing rules.
You'll also need to set up a storage account in the same region as your Load Balancer. This account will store flow logs and other diagnostic data. Ensure the necessary permissions for storage access are configured as detailed earlier.
Finally, create a monitoring workspace in Azure Monitor. This workspace will centralise the collection and analysis of diagnostic data from both Network Watcher and your Load Balancer. Having this workspace in place will streamline data monitoring and troubleshooting as you proceed.
Setting Up Load Balancer Diagnostics and Data Routing
Once your environment is configured, the next step is enabling diagnostic settings to gather detailed monitoring data from your Load Balancer. This involves choosing specific log categories and directing the collected information to suitable Azure services for analysis.
Enabling Diagnostic Settings
To set up diagnostics, open your Load Balancer in the Azure portal. Navigate to Monitoring > Diagnostic settings, then click + Add diagnostic setting to begin.
In the Diagnostic setting window, you’ll need to select the log and metric categories you want to monitor. For Load Balancer diagnostics, the main category is AllMetrics, which tracks key performance metrics like data path availability, health probe status, and byte counts. To manage costs effectively, focus on collecting only the essential log categories. Each Azure resource requires its own diagnostic setting, and you can create up to five settings per resource.
After selecting the log categories, the next step is to configure how and where the data will be routed.
Setting Up Data Routing
You can send diagnostic data to one of three destinations: Log Analytics Workspace, Storage Account, or Event Hub. Each option comes with its own advantages:
- Log Analytics Workspace: This is a popular choice for small and medium-sized businesses (SMBs) due to its centralised log management and powerful query tools. The workspace doesn’t need to be in the same region as your Load Balancer, and Azure will automatically create the necessary table for logs if it doesn’t already exist.
- Storage Accounts: Ideal for long-term storage, especially for compliance and archival purposes. It’s recommended to use a dedicated storage account for monitoring data. For regional resources, ensure the storage account is located in the same region as your Load Balancer.
- Event Hubs: This option is designed for real-time streaming of diagnostic data to external systems or applications. For regional resources, the event hub namespace must be in the same region as your Load Balancer. Additionally, you’ll need to configure specific permissions - Manage, Send, and Listen - using the shared access policy.
| Destination | Regional Requirements | Key Considerations |
|---|---|---|
| Log Analytics Workspace | Can be in any region | Automatic table creation; powerful querying capabilities |
| Storage Account | Must be in the same region | Use a dedicated account; consider immutable storage policies for compliance |
| Event Hub | Must be in the same region | Requires specific permissions; supports real-time data streaming |
Each destination requires its own diagnostic setting. By integrating these configurations into your environment setup, you can ensure that both diagnostic and data routing align with your operational and compliance needs.
UK-Specific Configuration Settings
For deployments in the UK, it’s worth noting that UK South serves as both a home region and a participating region for global Load Balancer deployments. This setup ensures strong performance for UK-based SMBs while maintaining global reach.
When routing diagnostic data, make sure to comply with UK data protection regulations. Storage accounts used for this purpose should be located in UK regions, such as UK South or UK West, to guarantee data sovereignty. If compliance requires immutable storage policies, follow Azure’s guidelines to enable protected append blob writes.
Set monitoring alerts to UK time zones and establish budgets based on your expected data volumes and retention needs, as determined during your environment setup. Additionally, to ensure that diagnostic settings can interact with storage accounts and Event Hubs, enable "Allow trusted Microsoft services" to bypass firewall restrictions. This step is particularly important for organisations with strict network security requirements.
Using Network Watcher for Load Balancer Troubleshooting
Once your diagnostic setup is in place, Network Watcher offers a range of tools to help you quickly identify and resolve Load Balancer connectivity issues. These tools complement the earlier diagnostic setup by providing deeper insights into potential problems.
Network Watcher Troubleshooting Tools
Network Watcher is automatically enabled when you create or update a virtual network within your subscription. It includes several tools designed specifically for diagnosing Load Balancer issues:
- IP Flow Verify: This tool checks endpoint communication and highlights any blocks caused by Network Security Group (NSG) rules. It’s especially useful for identifying whether NSG settings are preventing traffic from reaching your virtual machines.
- Connection Troubleshoot: Tests connectivity between virtual machines, FQDNs, URIs, or IPv4 addresses. It simplifies troubleshooting by checking NSGs, user-defined routes, and port configurations to pinpoint connectivity issues.
- Next Hop: Verifies routing tables to confirm that traffic is directed to the correct destination IP address. It helps identify routing misconfigurations that might disrupt traffic flow.
- NSG Diagnostics: Identifies traffic filtering problems at various levels, such as virtual machines, virtual machine scale sets, or application gateways. This is especially useful in Load Balancer setups with multiple layers of network security.
- For deeper analysis, Packet Capture lets you monitor and analyse network traffic, while VPN Troubleshoot is helpful for diagnosing hybrid network issues.
Combining Logs and Metrics for Analysis
Pairing Network Watcher tools with Load Balancer logs and metrics provides a more comprehensive view of your network. Virtual Network Flow Logs capture detailed IP traffic data within your virtual network, including traffic through the Load Balancer. Enabling Traffic Analytics alongside these logs helps you visualise traffic patterns, application ports, and identify top talkers, making it easier to determine whether problems originate from network issues or Load Balancer misconfigurations.
Your Log Analytics workspace acts as the central point for analysing this data. By using Kusto Query Language (KQL), you can create custom queries to connect findings from Network Watcher with Load Balancer diagnostics. Additionally, Azure Load Balancer’s multi-dimensional metrics, available through Azure Metrics, provide real-time insights that complement these tools. For instance, if Connection Troubleshoot identifies a connectivity issue, you can immediately check metrics like Data Path Availability and Health Probe Status to assess the broader impact on your service.
Common Troubleshooting Examples
Here are some practical examples of how you can use these tools:
- Failed Health Probes: If backend pool members show as unhealthy, start with IP Flow Verify to check whether NSG rules are blocking health probe traffic on the configured port. Follow this with Connection Troubleshoot to test connectivity between the Load Balancer and each backend pool member. If connectivity tests pass but health probes still fail, examine flow logs for unusual traffic patterns.
- Backend Pool Connectivity Issues: For intermittent service availability, use Next Hop to confirm that traffic is correctly routed to backend pool members. Then, run NSG Diagnostics to identify any security rules blocking specific traffic. Combine these findings with Load Balancer diagnostic logs to better understand actual traffic distribution.
- SNAT Port Exhaustion: If Load Balancer metrics indicate SNAT port exhaustion, use virtual network flow logs to identify which applications or services are consuming excessive outbound connections. Traffic Analytics can then help visualise connection patterns over time, making it easier to pinpoint the root cause.
To stay ahead of potential issues, consider setting up the following alert rules alongside Network Watcher diagnostics:
| Alert Type | Condition | Purpose |
|---|---|---|
| Load balancing rule unavailable | Data path availability equals zero or health probe status equals zero | Detects when all backend pool VMs are marked as down |
| VM availability significantly low | Health probe status falls below a defined percentage of the total pool | Warns when there aren’t enough healthy VMs to handle traffic |
| Outbound connections failing | SNAT Connection Count (filtered to Connection State = Failed) is greater than zero | Alerts you when SNAT ports are fully used up |
| Approaching SNAT exhaustion | Use alerts for SNAT port thresholds | Provides early warnings of potential connection issues |
For UK SMBs, make sure alert notifications are set to BST or GMT according to your UK configuration. This ensures your team receives updates during business hours.
Monitoring and Performance Best Practices
Keeping a close eye on Load Balancers and Network Watcher is crucial, but it’s all about finding the right balance between visibility and cost. The goal is to set up monitoring systems that catch potential problems early, without overspending on diagnostics.
Setting Up Monitoring Systems
Azure Monitor acts as a central hub for collecting and analysing metrics and logs from your entire system. It provides a clear view of system performance. When paired with Network Watcher's diagnostic tools, you gain deeper insights into how your applications and networks are functioning.
Connection Monitor offers continuous monitoring of network connectivity, helping you spot anomalies and trace issues to specific network components, whether in Azure or hybrid cloud setups. Unlike Connection Troubleshoot, which provides a single-point-in-time test, Connection Monitor tracks performance over time. This feature is especially useful for UK SMBs running hybrid environments where on-premises systems connect to Azure resources. For example, if your e-commerce platform relies on a smooth connection between web servers and backend databases, Connection Monitor can alert you if response times start lagging.
Virtual Network Flow Logs give a detailed breakdown of IP traffic within your virtual network, including Load Balancer traffic. Pair these logs with Traffic Analytics to get a clearer picture of traffic patterns, application usage, and any potential security risks. This helps pinpoint whether performance issues stem from network congestion, application slowdowns, or security threats.
The Network Insights feature provides a visual overview of your network's topology, health, and metrics. Using Network Watcher's Topology tool, you can visualise your network setup to identify weak points, such as single points of failure or inefficient routing paths.
To ensure timely responses without being overwhelmed by alerts, set custom thresholds for monitoring. For instance, configure alerts with an aggregation type of Average, using a five-minute data window and a 95% threshold. This reduces false alarms while keeping you informed. Resource Health alerts can also notify you if a Load Balancer enters a Degraded or Unavailable state. Together, these practices create a unified approach to monitoring and diagnostics.
Managing Diagnostic Costs
While monitoring is essential, keeping costs under control is just as important. Smart configurations can help you gather meaningful insights without overspending. For instance, Network Watcher itself doesn’t cost anything to enable, but charges apply for network logs, diagnostic checks, and Connection Monitor usage.
Analysing traffic logs can help you estimate your inbound and outbound traffic needs. Use these logs to identify peak usage times and adjust your monitoring efforts accordingly. For example, during quieter periods, you can scale back on certain diagnostics while maintaining critical checks for business hours.
Optimising Load Balancer rules can also help reduce costs. Instead of creating individual rules for each endpoint, group them by port ranges connected to backend pools. This reduces the number of rules and simplifies management. Additionally, analyse logs to identify unused Load Balancer instances. Deleting unnecessary instances can save on costs, especially for those not linked to backend VMs.
Flow cost optimisation is another useful tactic. Use efficient protocols and data compression to reduce traffic loads and overall expenses. Consolidating backend processes can further reduce traffic volume and costs.
For more detailed tips on managing Azure costs, check out Azure Optimization Tips, Costs & Best Practices. It’s packed with expert advice tailored to SMBs scaling their operations on Microsoft Azure.
Integration Methods Comparison
Choosing the right monitoring tools depends on your needs and budget. Each integration method offers different benefits and trade-offs:
| Integration Method | Advantages | Limitations | Best for UK SMBs |
|---|---|---|---|
| Basic Azure Monitor + Load Balancer Metrics | Low cost, built-in functionality, real-time insights via multi-dimensional metrics | Limited network-level visibility, reactive rather than proactive | Small businesses with simple Load Balancer setups and tight budgets |
| Network Watcher + Connection Monitor | Continuous monitoring, hybrid environment support, proactive anomaly detection | Higher costs for extensive monitoring, requires careful configuration | Growing SMBs with hybrid infrastructure or critical uptime requirements |
| Full Integration with Traffic Analytics | Comprehensive visibility, security threat detection, traffic pattern analysis | Highest cost, complex setup, potential data retention charges | Established SMBs with complex networks or compliance requirements |
| Selective Monitoring with Custom Alerts | Balanced cost-effectiveness, targeted insights, configurable thresholds | Requires ongoing tuning, may miss unexpected issues | Most UK SMBs seeking optimal cost-performance balance |
For example, the Standard Load Balancer costs around £0.019 per hour (roughly £14 per month) for up to five load-balancing rules, plus a small fee per GB of data processed. Standard Public IPs add an additional £0.0027–£0.0038 per hour, or about £2–£3 per month. These costs can vary based on UK-specific configurations.
Tools like Azure Monitor Insights for Load Balancer make it easier to diagnose and resolve issues quickly. It’s a great starting point for SMBs looking to keep things simple before expanding into more advanced monitoring setups.
Finally, don’t forget to account for operational costs beyond Azure charges, such as maintenance, scaling, and compliance. Azure Advisor can provide tailored recommendations aligned with the Well-Architected Framework to help optimise your Azure deployments. These insights can complement your monitoring strategy and keep your operations running smoothly.
Conclusion
Bringing together Network Watcher and Load Balancer diagnostics creates a robust framework for monitoring and troubleshooting, giving UK SMBs the tools they need to manage their Azure infrastructure effectively. This integration offers the visibility required to ensure services remain reliable, while also providing actionable insights to maintain and optimise performance.
Key Takeaways
The integration starts with enabling diagnostic settings on your Load Balancer to gather key metrics and logs. These can then be analysed through Azure Monitor and Log Analytics. This setup not only helps detect performance issues early but also equips you with the data to make smarter infrastructure decisions.
Tools provided by Network Watcher - like IP flow verify, NSG diagnostics, and packet capture - offer deep troubleshooting capabilities that work hand-in-hand with Load Balancer metrics. Together, they streamline the process of identifying and addressing network issues, helping to minimise downtime and improve the overall user experience.
Different monitoring approaches cater to varying levels of insight and cost, allowing UK SMBs to tailor their strategy to meet both operational needs and budget limitations.
Practical Steps for SMBs
To implement a cost-effective and reliable diagnostic strategy, consider these steps:
- Set up alerts for critical conditions, such as low data path availability or high SNAT connection failures. Taking a proactive stance can help prevent minor issues from escalating into major disruptions.
- Use Azure Monitor and Log Analytics to analyse logs and metrics. Custom queries can help uncover Load Balancer performance trends and traffic distribution patterns, aiding in long-term capacity planning.
- Optimise Load Balancer rules by defining broader port ranges rather than specifying individual IP addresses and ports. This simplifies configurations and enhances efficiency.
- Leverage Microsoft Cost Management to track spending, set budgets, and configure alerts for load balancing costs. The Basic Load Balancer is included with Azure subscriptions at no additional cost, while the Standard Load Balancer pricing ranges from £0.018 to £0.058 per hour. Being aware of your usage allows you to select the most suitable tier for your business.
By integrating these tools and strategies, UK SMBs can deliver dependable services, resolve issues quickly, and manage costs effectively - key ingredients for scaling operations successfully on Azure.
For additional guidance on managing Azure performance and costs, check out Azure Optimization Tips, Costs & Best Practices.
FAQs
What advantages does integrating Network Watcher with Load Balancer Diagnostics offer for small and medium-sized businesses using Azure?
Integrating Network Watcher with Load Balancer Diagnostics gives small and medium-sized businesses (SMBs) on Azure a solid way to monitor and troubleshoot their network setups. This combination lets you examine traffic flow, pinpoint connectivity problems, and quickly address network slowdowns, helping your operations run more smoothly.
With better network reliability and performance, businesses can minimise downtime and improve service delivery. This is particularly useful for SMBs looking to fine-tune their Azure environment while keeping operations efficient and cost-effective. For more advice on getting the most out of Azure, check out expert resources that focus on enhancing cloud performance and managing costs effectively.
What permissions do I need to integrate Network Watcher with Load Balancer diagnostics in Azure?
To connect Network Watcher with Load Balancer diagnostics in Azure, you'll need the right permissions assigned to your account. Roles such as Network Contributor or Owner usually provide the necessary access to manage diagnostic settings and monitoring. These roles grant permissions for resources like Microsoft.Network/networkWatchers/* and Microsoft.Network/loadBalancers/*.
If you're uncertain about your current permissions, it's a good idea to reach out to your Azure administrator. They can confirm your role or help you get the required access. Having the correct permissions ensures a hassle-free setup and allows for efficient monitoring and troubleshooting of your load balancer.
What are the main differences between Log Analytics Workspace, Storage Accounts, and Event Hubs for managing Azure diagnostic data?
When it comes to handling diagnostic logs, each storage option serves a distinct purpose based on your needs.
Log Analytics Workspace shines when it comes to advanced querying and in-depth analysis. With the power of Kusto Query Language (KQL), it’s an excellent choice for troubleshooting and uncovering detailed insights into how your resources are performing.
Storage Accounts are the go-to for archiving logs. They offer a budget-friendly way to store data for the long term. However, their querying capabilities are limited, making them better suited for compliance requirements or backup purposes rather than detailed analysis.
Event Hubs are built for real-time data streaming and seamless integration with external systems. They handle high-throughput scenarios with ease, making them ideal for scalable ingestion and distribution of diagnostic data.
To sum up: use Log Analytics for detailed analysis, Storage Accounts for long-term archiving, and Event Hubs for real-time streaming and external integrations.