Azure Performance Baseline: Step-by-Step Guide
Learn how to establish and maintain Azure performance baselines to enhance efficiency, monitor metrics, and support growth.
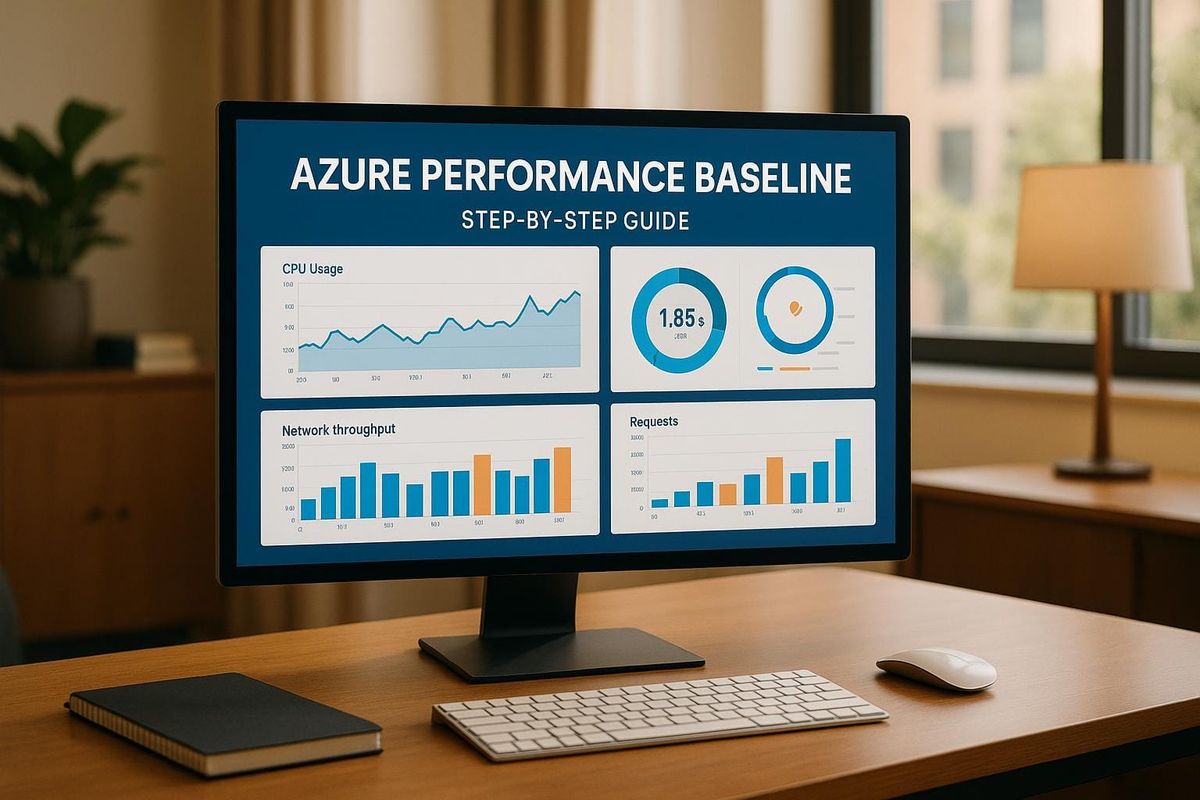
Azure performance baselines help you monitor key metrics like CPU usage, memory, and network latency. They allow you to:
- Spot issues early by comparing live data to benchmarks.
- Optimise resources to save costs and improve efficiency.
- Plan for growth with historical data for scaling decisions.
Key Metrics to Monitor:
- Computing: CPU and memory usage for application speed.
- Storage: IOPS and latency for fast data access.
- Network: Bandwidth and packet loss for stable connections.
- Application: Response times and error rates for user experience.
Quick Steps to Create a Baseline:
- Identify critical systems and set alert levels.
- Use tools like Azure Monitor and Log Analytics.
- Run performance tests during peak and off-peak hours.
- Analyse results and define thresholds (e.g., CPU >80%).
Maintain Baselines:
- Review metrics weekly, adjust quarterly.
- Automate monitoring with Azure Monitor Workbooks.
- Use Azure Advisor for improvement recommendations.
Set baselines, monitor regularly, and adjust as your workloads evolve. This ensures reliable performance while managing costs effectively.
Azure Monitor Baseline Alerts
Creating an Azure Performance Baseline
To establish a reliable performance baseline for your Azure environment, follow these steps carefully.
1. Identify Key Systems and Resources
Start by listing all critical Azure resources and categorising them based on their importance:
| Priority Level | Resource Type | Alert Level |
|---|---|---|
| Critical | Production workloads, customer-facing services | Real-time alerts |
| Important | Internal business applications, data processing | Daily reviews |
| Standard | Development environments, testing systems | Weekly checks |
2. Configure Monitoring Tools
Set up the necessary tools to monitor your Azure environment effectively:
- Enable Azure Monitor for all critical resources.
- Create and configure a Log Analytics workspace.
- Build custom dashboards for a clear overview.
- Define alert rules based on specific thresholds.
3. Conduct Performance Tests
Run performance tests during typical operating conditions to capture accurate data:
-
System Warm-up Period
- Allow systems to reach a steady state.
- This usually takes between 30–60 minutes.
-
Load Testing Schedule
- Test during peak hours: 10:00–14:00.
- Include off-peak times: 22:00–02:00.
- Don't forget weekends and critical periods like month-end processing.
4. Capture and Analyse Results
Use the following metrics to establish your baseline:
| Metric Category | Standard Range | Alert Threshold |
|---|---|---|
| CPU Utilisation | 40–60% | >80% |
| Memory Utilisation | 50–70% | >85% |
| Storage IOPS | 100–500/sec | >1,000/sec |
| Network Latency | 5–15ms | >50ms |
Review these metrics weekly to identify normal operating ranges. Adjust your baseline quarterly or whenever significant changes occur in your environment.
Azure Performance Tips
Use your baseline metrics as a guide to fine-tune these performance strategies.
Resource Location and Network Setup
Place interconnected resources within the same Azure region. This reduces latency and helps maintain steady performance levels.
SMB Channel Management
Configure file-sharing settings and network channels to handle multiple connections effectively. This ensures smooth and consistent performance for shared resources.
VM and Storage Settings
Align virtual machines (VMs) with your workload requirements and select a storage tier that matches your input/output (I/O) demands. Consider high-performance storage options, enable network acceleration, and use auto-scaling based on your baseline data. For more guidance on improving performance and managing costs, check out the blog "Azure Optimization Tips, Costs & Best Practices".
Fixing Common Performance Problems
Reducing High Latency
High latency often results from inefficient resource setups or network configurations. Start by analysing Azure Monitor metrics to identify bottlenecks, paying close attention to Network Interface throughput and Storage latency.
For tasks involving large amounts of data, try these adjustments:
- Update the registry at
HKEY_LOCAL_MACHINE\SYSTEM\CurrentControlSet\Services\Tcpip\Parametersto improve TCP window scaling on Windows virtual machines. - On Linux virtual machines running kernel version 4.9 or newer, enable TCP BBR congestion control.
- Use Azure Accelerated Networking on compatible virtual machine sizes to lower CPU usage and reduce latency.
Client Performance Differences
Once latency is addressed, focus on managing client-specific performance variations. These differences are often tied to regional access patterns and unique client setups. Tailor your approach by region:
| Region | Action to Take | Expected Benefit |
|---|---|---|
| UK South | Use Premium SSD storage for critical workloads | Better I/O performance |
| UK West | Enable zone-redundant storage | Increased availability |
| Northern Europe | Set up Azure Front Door for content delivery | Faster loading speeds |
Speed and Bandwidth Limits
Check your current bandwidth usage against Azure's service limits. To optimise performance, consider these methods:
- Set up autoscaling rules based on network usage metrics.
- Use Azure ExpressRoute for more consistent and reliable performance.
- Leverage Azure Traffic Manager for smarter routing decisions.
To further reduce load, enable data compression, caching, and use Azure CDN for static content. Keep an eye on your Network Security Groups (NSGs) for signs of throttling. Set up alerts to notify you when bandwidth usage approaches your limit, allowing you to address potential issues before they impact performance.
Maintaining Your Performance Baseline
Keep your performance on track by using Azure Monitor to automatically monitor KPIs with custom thresholds tailored to your workload changes.
Set up a review schedule that aligns with your workload patterns:
| Review Type | Frequency | Key Focus Areas |
|---|---|---|
| Routine Check | Weekly | Resource usage, latency metrics |
| Deep Analysis | Monthly | Cost control, scaling trends |
| Full Assessment | Quarterly | Infrastructure needs, growth plans |
These reviews help identify areas for improvement. Use Azure Advisor to get personalised recommendations for boosting performance. Set up alerts to inform your team if metrics deviate from the established baseline.
Document any changes to your baseline in your tracking system, including the reasons and outcomes. Then, automate these checks:
- Keep an eye on CPU, memory, and storage usage.
- Track latency, throughput, and connection metrics.
- Measure the user experience across different regions.
Leverage Azure Monitor Workbooks to build visual dashboards that show baseline metrics alongside current data. This makes it easier to spot trends and detect anomalies at a glance.
FAQs
How do I keep my Azure performance baseline effective as my business grows and changes?
To keep your Azure performance baseline effective, it’s essential to regularly review and adapt it as your business evolves. Monitor key metrics such as resource usage, costs, and application performance to identify areas needing optimisation.
Focus on cost efficiency, scalable architecture, and security best practices to ensure your Azure environment meets both current and future needs. Regular updates and testing will help maintain performance and align with your business goals.
What mistakes should I avoid when creating performance baselines and setting up monitoring tools in Azure?
When establishing performance baselines and configuring monitoring tools in Azure, there are a few common pitfalls to be mindful of:
- Ignoring key metrics: Ensure you identify and track the most relevant metrics for your workloads, such as CPU usage, memory consumption, and network latency. Focusing on the wrong metrics can lead to ineffective monitoring.
- Overlooking baseline updates: Performance baselines should evolve as your environment changes. Regularly review and update them to reflect any new workloads, scaling, or configuration changes.
- Setting unrealistic thresholds: Avoid setting thresholds that are either too strict or too lenient. Unrealistic thresholds can lead to unnecessary alerts or missed issues.
By addressing these mistakes, you can establish a more reliable and actionable performance baseline for your Azure environment.
How can I use Azure Monitor Workbooks to analyse and visualise my performance baseline metrics?
Azure Monitor Workbooks are a powerful tool for visualising and interpreting your performance baseline metrics on Azure. They allow you to create interactive reports and dashboards, helping you track key metrics like CPU usage, memory consumption, and network performance over time.
To get started, navigate to the Azure portal and access the Monitor service. From there, select Workbooks to create or customise templates that suit your needs. Make use of pre-built templates or design your own to focus on the metrics most critical to your workload. By doing so, you can identify trends, spot anomalies, and optimise your Azure environment effectively.
For further optimisation tips, consider exploring best practices for cloud performance and cost management tailored to SMBs.