Top Metrics to Monitor in Azure for Better Performance
Which metrics to track in Azure—file capacity, transactions, availability, latency, ingress/egress and throttling—and how Azure Monitor and diagnostics can help.

Monitoring the right metrics in Azure can help you improve system performance, avoid downtime, and reduce costs. Here’s a quick summary of the key metrics every business should track:
- File Capacity: Prevent storage issues by setting alerts when usage nears capacity. Regular checks help optimise storage and avoid throttling.
- Transaction Count: Understand system usage and spot inefficiencies. High transaction counts can lead to throttling, so monitor closely.
- Availability: Ensure uptime across your resources. Anything below 99% availability needs immediate attention.
- Latency: Track response times to improve user experience. Compare end-to-end and server latency to find bottlenecks.
- Ingress and Egress: Monitor data flow to identify network issues and optimise costs.
- Throttling and Resource Limits: Avoid hitting API and resource limits by tracking usage and implementing self-throttling mechanisms.
- Performance Diagnostics Tools: Use tools like PerfInsights and VM Insights for detailed analysis of resource bottlenecks.
Set up alerts, use Azure Monitor, and track these metrics regularly to maintain a stable, cost-efficient Azure environment. For more tips, visit Azure Optimization Tips, Costs & Best Practices.
1. File Capacity
Why File Capacity Matters for Azure Performance
File capacity plays a crucial role in keeping your Azure storage running smoothly. If a storage account hits its limit, it can disrupt all dependent services. For example, applications might fail to save critical user or system data. Azure provides metrics to help you monitor this: the UsedCapacity metric shows the total bytes used across all services (blob, table, file, and queue), while the File Capacity metric zeroes in on specific file shares. These metrics are updated hourly by Azure Monitor.
Practical Tips for SMBs
To avoid running into storage issues, it’s smart to set alerts when usage reaches 80% of capacity. This gives you enough time to scale up before hitting the limit. For instance, on a 100 TiB file share, set the alert threshold at 87,960,930,222,080 bytes. Regular monitoring not only prevents outages but also helps identify underused accounts, which can be downsized to save costs. The Storage Insights dashboard makes this easier by letting you sort accounts by "Account used capacity" to quickly spot idle resources. For more advice on improving your Azure setup, check out Azure Optimization Tips, Costs & Best Practices.
Simplifying Monitoring with Azure Monitor
To make tracking easier, consider using the Provisioned v2 billing model instead of pay-as-you-go. This model offers per-share metrics via the FileShare dimension. In Metrics Explorer, you can split metrics by FileShare to pinpoint which shares are consuming the most space. For automation, use the Azure CLI to run hourly capacity checks with this command:
az monitor metrics list --resource <resource-ID> --metric "UsedCapacity" --interval PT1H
This approach ensures you stay on top of your storage usage.
Avoiding Scalability and Reliability Issues
Hitting capacity limits can lead to throttling, which increases latency and causes errors like ServerBusyError or ClientThrottlingError. This is especially problematic for workloads with high metadata demands. To prevent this, monitor the "Success with Metadata Warning" metric and, if necessary, split workloads across multiple file shares when one consistently approaches capacity.
2. Transaction Count
Relevance to Azure Performance Monitoring
The transaction count metric tracks every request made to your Azure services, covering everything from data operations to management tasks. This is a key metric because it provides insight into how heavily your systems are being utilised and whether they're approaching their performance thresholds. Azure Monitor gathers these metrics every minute and retains the data for 93 days.
Using dimensional filtering, you can break down transactions by attributes like ResponseType and ApiName. This allows you to go beyond the total transaction number and pinpoint specific issues, such as ServerBusyError, or identify which operations - like GetBlob or PutBlob - are driving the load. Nawaz Dhandala from OneUptime highlights:
A sudden 10x increase in transactions might be normal during a scheduled batch job, or it might indicate a misconfigured client in a tight retry loop.
Actionable Insights for SMBs
Set up alerts for ServerBusyError thresholds to detect performance issues early. For resource-heavy environments, automate your monitoring efforts with the Azure CLI:
az monitor metrics list --resource <resource-ID> --metric "Transactions" --interval PT1H
. For Azure Storage accounts, you can use Metrics Explorer to filter by the "API Name" dimension, helping you identify whether read, write, or list operations are consuming the most resources. This level of detail can guide you in refining application behaviour and cutting down on costs by addressing inefficient usage patterns.
For more strategies on managing Azure costs and performance, visit Azure Optimization Tips, Costs & Best Practices at https://azure.criticalcloud.ai.
These insights are crucial for making informed autoscaling decisions and enhancing overall system reliability.
Impact on System Scalability and Reliability
High transaction volumes can lead to throttling when limits on CPU, storage, or namespace operations are exceeded. For instance, in Azure Service Bus Premium, throttling is triggered if the pending checkpoint count surpasses 500,000, with an additional 500,000 per messaging unit. When these thresholds are breached, you may encounter higher latency and application failures.
Transaction monitoring also plays a key role in autoscaling. Virtual Machine Scale Sets can be configured to scale based on metrics like ApproximateMessageCount in a Storage queue or ActiveMessageCount in a Service Bus queue. This dynamic scaling ensures your infrastructure adjusts to traffic demands, maintaining reliability during surges and optimising costs during quieter periods. Much like file capacity metrics, transaction metrics are vital for avoiding throttling and ensuring smooth performance across Azure services.
3. Availability
Relevance to Azure Performance Monitoring
Availability reflects the uptime of Azure resources like Virtual Machines, databases, and networking components. It's a key metric within the Azure Well-Architected Framework under the "Reliability" category. As Site24x7 puts it:
"Availability assures your cloud workload has a constant 24*7 uptime year-round - the first and most important metric in cloud systems".
For small and medium-sized businesses (SMBs) that depend on cloud applications, downtime can directly affect operations and revenue. Arshad Shariff, a Technical Content Writer at ManageEngine, highlights this by stating that "any interruptions or issues with performance can have a significant impact on operations and revenue". Monitoring availability across all layers - compute (VM uptime), storage (data accessibility), and networking (service connectivity) - provides a comprehensive view of Azure performance. Combined with metrics like file capacity and transaction counts, availability data becomes a cornerstone for effective performance tracking through Azure Monitor.
Ease of Tracking via Azure Monitor
Azure Monitor simplifies availability tracking by automatically collecting platform metrics without additional configuration or costs. These metrics are updated every minute and stored for 93 days. Tools like Metrics Explorer allow users to analyse trends interactively across compute, storage, and networking layers. Charts can be pinned to dashboards for a consolidated view. For Azure Files, the "Availability" metric, when viewed using the "Average" aggregation, reveals the percentage of requests that encounter errors compared to your service-level agreement (SLA).
Actionable Insights for SMBs
Detailed resource-level data can help identify the root causes of downtime. Alerts can be set for critical issues, such as unavailable components or high VM CPU usage, which could signal potential crashes. Constant monitoring of network health is crucial, as network failures often appear as application downtime. Adaptive thresholds, which adjust based on workload changes, can reduce unnecessary alerts and ensure notifications are meaningful.
Impact on System Scalability and Reliability
Monitoring availability supports reliability by aiming for continuous uptime across compute and storage services, minimising business disruptions. It also plays a role in scalability, as it tracks how resources handle increased data loads and request volumes, ensuring smooth operations during peak demand. By using historical availability data, businesses can establish performance baselines, making it easier to spot anomalies or unusual resource usage patterns. Understanding current availability levels allows SMBs to fine-tune their performance strategies more effectively.
For more tips on optimising Azure performance, costs, and security, check out Azure Optimization Tips, Costs & Best Practices (https://azure.criticalcloud.ai).
4. Latency
Relevance to Azure Performance Monitoring
Latency metrics play a key role in understanding user experience and system responsiveness, complementing file capacity and transaction monitoring. Essentially, latency measures the time it takes for systems to respond across compute, storage, and network layers. It’s considered the second most important metric in cloud environments, following availability. When users interact with your application, latency determines whether their experience is smooth or plagued by frustrating delays.
Azure monitors latency with metrics like SuccessE2ELatency, which tracks the total time from request to response (including network transit), and SuccessServerLatency, which focuses solely on processing time within Azure services. For Application Gateway, metrics such as Backend Connect Time and Backend First Byte Response Time help pinpoint specific areas of slowdown. With these tools, Azure provides a clear picture of where delays occur, ensuring you can address issues effectively.
Ease of Tracking via Azure Monitor
Azure Monitor simplifies latency tracking by automatically publishing metrics every minute. With Metrics Explorer, you can analyse P50, P95, and P99 latency percentiles, create visual dashboards, and even set alerts for when end-to-end latency exceeds 100 milliseconds over a five-minute period. For virtual machines, disk latency is monitored separately for OS, Data, and Temporary disks, with detailed metrics emitted every minute. These per-disk metrics are particularly useful for identifying bottlenecks and understanding performance at a granular level.
Actionable Insights for SMBs
Comparing end-to-end latency with server latency can help pinpoint the source of issues. For example, if end-to-end latency is high but server latency is normal, the network may be the culprit - perhaps due to clients accessing storage from a distant region. On the other hand, if Backend First Byte Response Time spikes while Backend Connect Time remains stable, the backend application might be the issue.
Performance can also degrade if a single container holds millions of blobs without proper partitioning. Using Kusto Query Language (KQL) in Log Analytics, you can filter operations exceeding 500 milliseconds to identify specific API failures. These insights allow SMBs to address bottlenecks and improve both scalability and reliability.
Impact on System Scalability and Reliability
High latency often indicates resource saturation, such as overloaded backend servers or application bottlenecks. For example, if disk latency correlates with high Queue Depth (outstanding IO requests), it may be time to upgrade to premium disks. Setting threshold alerts for latency spikes ensures you can scale resources proactively, avoiding performance degradation. Historical latency data is invaluable for establishing baselines, spotting anomalies, and addressing potential issues before they impact end-users.
For more advice on improving Azure performance, reducing costs, and enhancing security, visit Azure Optimization Tips, Costs & Best Practices.
5. Egress and Ingress
Relevance to Azure Performance Monitoring
Ingress and egress metrics are crucial for tracking the flow of data into and out of Azure services. These metrics provide insights into network health and can highlight potential bottlenecks. Simply put, ingress refers to data entering Azure, while egress is data leaving Azure. By keeping an eye on these metrics, you can identify whether performance issues stem from client network limitations, Azure’s internal systems, or backend server overloads. For example, sudden spikes or drops in packet rates can signal network congestion, packet loss, or TCP saturation [27, 31]. Regular monitoring allows small and medium-sized businesses (SMBs) to detect anomalies early and address them before they impact users.
Ease of Tracking via Azure Monitor
Azure Monitor simplifies the process by automatically collecting ingress and egress metrics for most resources - like Virtual Machines, App Services, and Storage accounts - at no extra cost [30, 34]. Using Metrics Explorer, you can visualise trends and investigate traffic spikes across network interfaces. For a more detailed analysis, you can configure Diagnostic Settings to send logs to Log Analytics, enabling advanced queries with KQL [33, 35]. Additionally, setting up threshold alerts ensures administrators are notified via email or webhooks when throughput exceeds predefined limits. Metrics such as BytesReceived and BytesSent are especially useful for triggering autoscaling events in Web Apps and Virtual Machine Scale Sets, maintaining performance during periods of high traffic. This streamlined tracking helps businesses respond quickly to traffic anomalies.
Actionable Insights for SMBs
Beyond monitoring, these metrics can provide actionable insights to improve performance. Comparing ingress and egress trends with latency metrics can help pinpoint bottlenecks. For example, if traffic spikes align with increased backend connection times, it could indicate network saturation or issues with backend applications. High egress metrics might suggest large file transfers or inefficient data routing, while spikes in backend response times could highlight the strain caused by larger file sizes.
It's also worth noting that inbound data transfers are free, and the first 100 GB of internet egress per month comes at no cost. However, transferring data between different Azure regions incurs egress charges, which is important to consider when planning disaster recovery or high-availability solutions. To reduce costs, keep related resources in the same Azure region and explore options like Azure CDN or local caching to deliver data closer to end-users.
Impact on System Scalability and Reliability
Monitoring packet rates is essential for understanding traffic patterns and identifying capacity constraints. By analysing in- and out-packet rates, businesses can predict saturation points and set up autoscaling triggers, such as scaling Virtual Machine Scale Sets based on BytesSent [3, 31]. This proactive strategy ensures resources scale to meet demand, maintaining system reliability during traffic surges while keeping costs manageable through optimised data transfer practices.
For more tips on improving Azure performance and managing costs, check out Azure Optimization Tips, Costs & Best Practices.
6. Throttling and Resource Limits
Relevance to Azure Performance Monitoring
Throttling in Azure acts as a safeguard by limiting excessive API calls through a token bucket algorithm. This system uses a "bucket" that can hold a set number of tokens (representing requests) and refills at a steady rate per second. When these limits are exceeded, Azure returns HTTP 429 "Too Many Requests" errors, which can disrupt tasks like automated deployments, diagnostics, or system maintenance. Throttling occurs at two levels: the Azure Resource Manager level (impacting your entire subscription or tenant) and the Resource Provider level (specific to services like Compute, Storage, or Network). Keeping an eye on these limits is crucial to ensure your operations run smoothly, especially during high-demand periods.
Ease of Tracking via Azure Monitor
Azure makes it simple to track your approach to throttling limits through response headers. For instance, the x-ms-ratelimit-remaining-subscription-reads header shows how many read requests you have left before throttling is triggered, while x-ms-ratelimit-remaining-subscription-writes does the same for write operations. If you often query metrics, using the getBatch API instead of individual API calls can help you retrieve data for multiple resources in one go, reducing traffic to the Azure Resource Manager and lowering the risk of hitting limits. Should you encounter a 429 error, always follow the Retry-After header, which tells you how long to wait before retrying. This proactive approach helps you adjust operations to avoid disruptions during peak activity.
Actionable Insights for SMBs
For businesses using Free or Shared App Service plans, strict CPU quotas can be a bottleneck. Upgrading to Basic or higher tiers removes these restrictions, offering unlimited CPU and bandwidth. If your operations involve high volumes of automation or deployments, consider implementing self-throttling mechanisms in your applications to manage call volumes effectively. Tools like PowerShell's Export-AzLogAnalyticThrottledRequest can help analyse throttling violations and highlight problematic patterns. For adjustable "soft limits" such as vCPU quotas, submitting a free customer support request can allow you to increase capacity before reaching critical thresholds.
Impact on System Scalability and Reliability
Recent updates in 2024 significantly increased Azure's API limits, with write limits expanded 30×, delete limits 2.4×, and read limits 7.5×. These limits are now applied per region rather than per instance, improving flexibility. For Virtual Machines, the Update VM API has a resource-level bucket capacity of 12 tokens, refilling at a rate of 4 tokens per minute, while the subscription-level cap is set at 1,500 requests per minute. Background job throttling might still occur if overall traffic is too high. To mitigate resource-level throttling, you can use Azure Advisor to identify virtual machines with consistent high utilisation (above 90% CPU or memory) and upgrade to higher-performing SKUs. Instead of querying all VMs in your subscription and filtering locally, opt for location-based queries to reduce the strain on subscription limits. These strategies, combined with monitoring metrics like file capacity and latency, help maintain a scalable and reliable Azure environment.
For more tips on optimising Azure performance and managing costs, visit Azure Optimization Tips, Costs & Best Practices.
7. Performance Diagnostics Tools
Relevance to Azure Performance Monitoring
Azure offers a range of diagnostic tools designed to go beyond basic metrics, helping identify performance bottlenecks with precision. For instance, PerfInsights can detect issues like high CPU, memory, or disk usage on virtual machines (VMs). It operates in two modes: continuous (proactive monitoring) and on-demand (for troubleshooting). Similarly, VM Insights delivers curated charts and key indicators to help pinpoint resource constraints across multiple VMs or scale sets. If you need a broader perspective, Azure Monitor Metrics Explorer now supports Prometheus Query Language (PromQL), enabling users to plot charts, identify trends, and investigate performance spikes using platform or custom metrics. For deeper analysis, Log Analytics employs Kusto Query Language (KQL) to sift through large volumes of logs, while Azure Workbooks allow you to combine text, log queries, and metrics into interactive, shareable reports. These tools enable detailed performance analysis, focusing on metrics like file capacity, latency, and throttling limits.
Ease of Tracking via Azure Monitor
Azure Monitor ensures that continuous diagnostics are efficient, with a minimal CPU overhead of less than 0.5% on Windows Servers. Metrics are retained for up to 93 days, although Metrics Explorer typically allows users to query only 30 days of data per chart. For small and medium-sized businesses (SMBs) mindful of budget constraints, Azure Monitor's billing is tied to the volume of data ingested. However, opting for capacity reservation tiers can reduce costs by up to 36% compared to pay-as-you-go pricing. According to an IDC study, organisations using Azure Monitor reported a 615% three-year ROI and achieved a 9% reduction in costs.
With its low system overhead and efficient data handling, Azure Monitor simplifies performance tracking while offering actionable insights.
Actionable Insights for SMBs
For SMBs, enabling Continuous Diagnostics on critical VMs can provide automated alerts for high resource usage, eliminating the need for manual checks. For quick, low-impact assessments, Quick Performance Analysis is ideal, while Benchmarking should be reserved for maintenance windows to avoid disrupting production environments. To improve autoscaling accuracy, rely on Guest OS metrics collected via the Azure Monitor Agent. These metrics offer more precise data on internal memory and disk usage compared to host metrics. Additionally, for secure data transfers, it’s recommended to use System-assigned or User-assigned managed identities instead of storage account access keys when authorising diagnostics.
Impact on System Scalability and Reliability
Azure's performance diagnostics tools play a crucial role in identifying bottlenecks before they lead to system outages. For instance, VM Insights simplifies setup by offering preconfigured Data Collection Rules for common performance counters in both Windows and Linux environments. SMBs can activate "Recommended alert rules" during VM creation to monitor availability and resource usage proactively, without requiring manual configuration. For more specific needs, there are tailored reports available for high-performance computing (HPC), SQL Server setups, and Azure Files (SMB client shares), which help address unique performance challenges. Additionally, PerfInsights can run in standalone mode, making it a valuable tool for troubleshooting non-Azure VMs or avoiding changes to existing configurations.
These diagnostic tools complement earlier metrics, offering a comprehensive view of your Azure environment and enabling precise performance tuning.
For more tips on optimising Azure performance and managing costs, check out Azure Optimization Tips, Costs & Best Practices.
Monitoring Azure File Shares: Performance Metrics, Alerts, and Action Groups Explained!
Comparison Table
Azure Performance Metrics Comparison: Aggregation Types and Use Cases
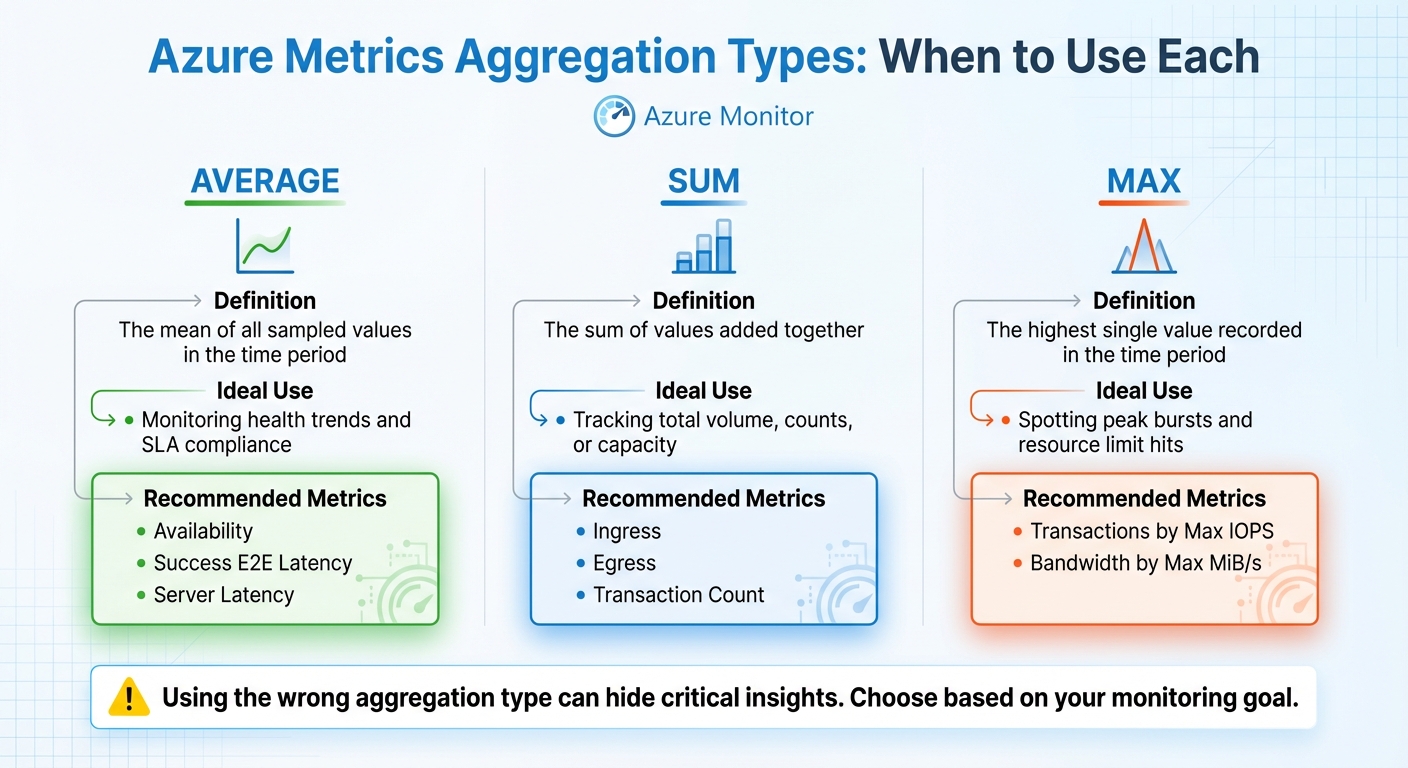
These aggregation methods work alongside the earlier metrics to summarise data trends effectively. Selecting the right type of aggregation is key to accurately interpreting metric values over a defined time period. Whether it's Average, Sum, or Max, each serves a distinct role. Using the wrong one could hide critical insights.
Average calculates the mean of all sampled values in a time interval. It's a go-to choice for monitoring steady-state performance and ensuring adherence to Service Level Agreements (SLAs). By focusing on typical performance rather than outliers, it gives a balanced view of system health.
Sum adds up all values within the time frame, making it indispensable for assessing total volume or overall counts. For instance, when analysing Ingress or Egress, Sum helps determine the total data transmitted. Opting for Average or Max here might only reflect the size of individual I/O operations (e.g., 1 MiB), missing the broader picture of total bandwidth usage.
Max pinpoints the highest single value recorded during the interval. This is especially useful for identifying spikes, peak loads, or when a resource is nearing its performance limits or throttling thresholds. For example, Transactions by Max IOPS reveals the peak pressure the system endured, which is often far greater than the average. Similarly, Max latency highlights outliers, offering insight into rare but critical performance issues.
| Aggregation Type | Definition | Ideal Use | Recommended Azure Metrics |
|---|---|---|---|
| Average | The mean of all sampled values in the time period. | Monitoring health trends and SLA compliance. | Availability, Success E2E Latency, Server Latency |
| Sum | The sum of values added together. | Tracking total volume, counts, or capacity. | Ingress, Egress, Transaction Count |
| Max | The highest single value recorded in the time period. | Spotting peak bursts and resource limit hits. | Transactions by Max IOPS, Bandwidth by Max MiB/s |
Conclusion
Keeping a close eye on Azure metrics is key to maintaining system stability, managing costs, and ensuring a responsive user experience. For SMBs working with tight budgets, regular monitoring can pinpoint overprovisioned resources and eliminate unnecessary expenses before they affect your bottom line. By understanding normal behaviours for metrics like CPU utilisation, latency, and transaction counts, you can catch potential problems early - before they turn into outages.
Establishing baseline metrics over a minimum of seven days helps differentiate short-term spikes from sustained issues. This historical data reveals consistent usage patterns and provides a clearer picture of your system's performance. While 100% uptime is the ultimate goal, anything below 99% availability indicates an urgent need for improvement.
To summarise performance effectively, use specific metrics: Sum for Ingress/Egress, Max for peak bursts, and Average for latency. These together provide a well-rounded view of your system's health.
By combining these practices, you can create a strong and reliable Azure setup. Set alerts for critical thresholds - like network latency exceeding 500ms or excessive CPU usage in a virtual machine. Regularly adjust resource allocations based on real-time performance data to address issues as they arise. Ensure your applications operate well within virtual machine limits to handle sudden traffic surges without disruption. Tools like Azure Monitor and Azure Advisor can further assist by providing ongoing optimisation recommendations.
For more detailed advice on cost management, cloud architecture, and scaling strategies for SMBs using Microsoft Azure, check out Azure Optimization Tips, Costs & Best Practices. With disciplined metric tracking and expert guidance, your Azure environment can remain efficient, scalable, and ready to support your business growth.
FAQs
Which Azure metrics should I prioritise first?
To maintain a system that's available, responsive, and efficient, it's essential to focus on specific metrics that provide insight into its performance.
- CPU and memory usage: These are vital for understanding resource health. Keeping an eye on them helps identify and prevent bottlenecks before they impact operations.
- Network metrics: Metrics like bandwidth and packet loss are critical for ensuring stable and reliable connections, especially in environments where uninterrupted communication is a priority.
- Storage performance: Monitoring IOPS (Input/Output Operations Per Second) and latency is crucial for assessing how well your storage systems handle workloads.
- Response times and error rates: These directly reflect the user experience. Quick response times and minimal errors indicate a system that can handle growing demands without compromising on quality.
By keeping these metrics in check, you can ensure your systems remain healthy and scalable, even as workloads increase.
How do I choose Average vs Sum vs Max for a metric?
When deciding between Average, Sum, and Max, it all comes down to what you're trying to track.
- Average is ideal for gauging typical performance, like monitoring average CPU usage over time.
- Sum works best for cumulative metrics, such as the total amount of data transferred.
- Max is your go-to for spotting peaks, like identifying the highest CPU usage during a specific period.
Picking the right option ensures you get the insights you need for effective performance monitoring and capacity planning in Azure.
What’s the quickest way to diagnose a latency spike?
Azure offers a range of built-in tools to help you keep an eye on network latency and performance in real-time. Azure Monitor and Network Watcher are two key resources that make this possible.
With Network Watcher’s Connection Monitor, you can receive alerts whenever issues arise, ensuring you're always in the loop. For more specific latency measurements, tools like Latte for Windows virtual machines and SockPerf for Linux virtual machines come in handy.
Another quick way to reduce latency is by placing interdependent resources within the same Azure region. This simple adjustment can improve performance while you work on deeper diagnostics.