5 Steps to Automate Incident Alerts in Azure
Automate Azure incident alerts with Microsoft Sentinel: connect data sources, enable incident creation and automation rules, notify teams and run playbooks.

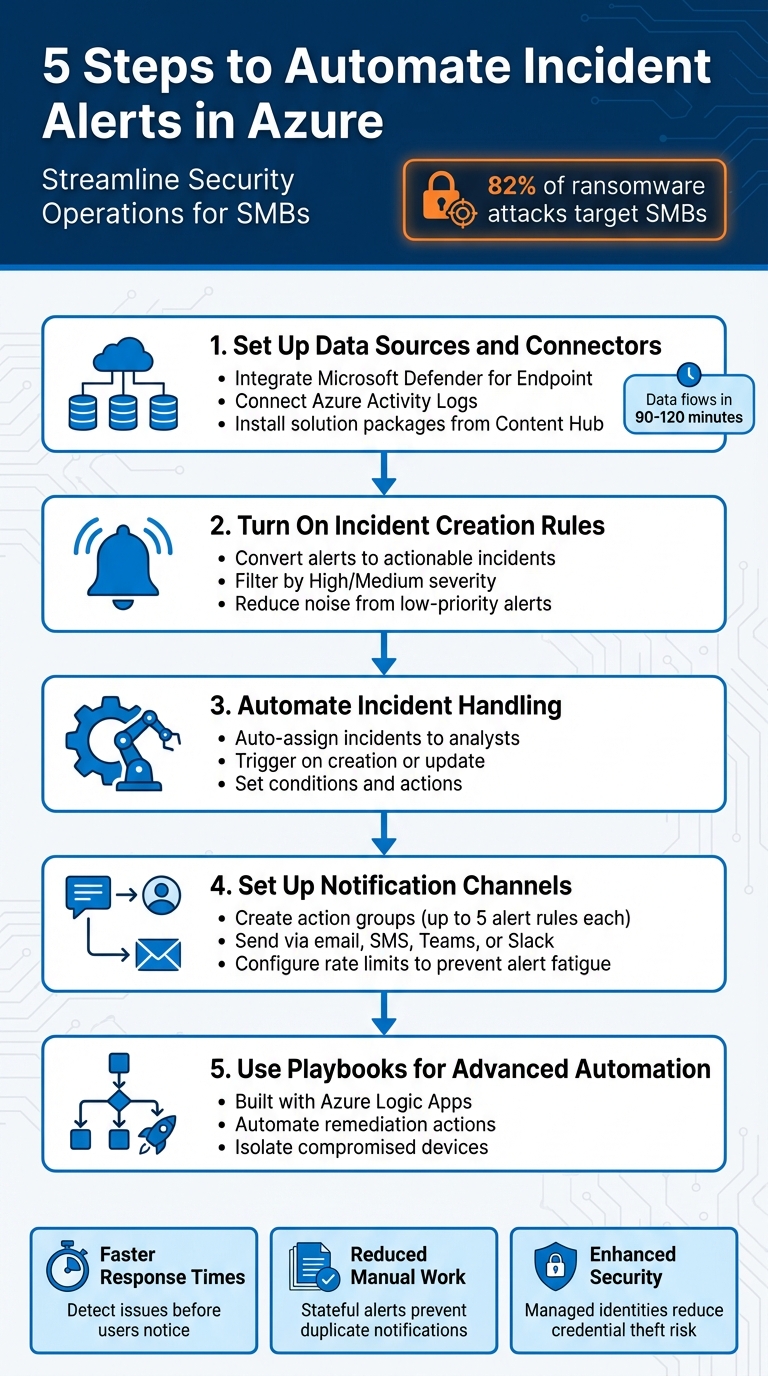
Cyberattacks are increasingly targeting small and medium-sized businesses (SMBs), with 82% of ransomware attacks aimed at them. Yet, many SMBs lack the resources for continuous security monitoring. Manual processes are time-consuming and prone to errors, leading to missed threats. Automating incident alerts in Azure helps streamline security operations, prioritise real issues, and improve response times.
Here’s a quick summary of how to automate incident alerts in Azure:
- Connect Data Sources: Integrate tools like Microsoft Defender or Azure Activity Logs with Microsoft Sentinel.
- Enable Incident Creation Rules: Turn alerts into actionable incidents while filtering by severity to reduce noise.
- Set Automation Rules: Automate repetitive tasks like assigning incidents or triggering playbooks.
- Configure Notification Channels: Use action groups to send alerts via email, SMS, Teams, or Slack.
- Build Advanced Playbooks: Use Azure Logic Apps to create workflows for incident responses, such as isolating compromised devices.
5 Steps to Automate Incident Alerts in Azure - Complete Workflow
Automate Incident Response with Microsoft Sentinel Playbooks | Step by Step Demo
Step 1: Set Up Data Sources and Connectors
To get Microsoft Sentinel up and running, you’ll need to connect it to security data sources like Microsoft Defender for Endpoint, Defender for Identity, or Azure Activity logs. These connections supply the data Sentinel uses to function effectively.
Start by heading to the Microsoft Sentinel Content Hub to install the solution package for your chosen data source. Once installed, go to Configuration > Data connectors and pick the right connector for your needs. Microsoft provides several connection options:
- Service-to-service for real-time integration with Microsoft tools.
- Agent-based for Linux or on-premises systems using the Azure Monitor Agent.
- Diagnostic settings for Azure services like Storage or Activity logs.
If you’re working with tools that don’t have built-in support, you can create custom connectors using the Codeless Connector Framework or Logic Apps.
Connect Security Tools to Microsoft Sentinel
After selecting your connector, it’s critical to check the Prerequisites section. Ensure you have the proper read/write permissions and, for some Defender features, an E5 licence. Once the requirements are met, enable the connector and make sure to tick the box under "Create incidents – Recommended". This ensures that any alerts brought into Sentinel automatically generate incidents, preventing them from being overlooked in the SecurityAlert table.
It’s worth noting that Microsoft Sentinel is moving to the Microsoft Defender portal, with support for the Azure portal ending on 31st March 2027. If you’re still using the Azure portal, now’s the time to get familiar with the Defender interface to ensure a smooth transition.
Check Data Flow into the SecurityAlert Table
Once the connector is active, data should start flowing into Sentinel’s data lake within 90–120 minutes. To confirm everything is working, use the Advanced hunting page in the Defender portal or the Logs page in the Azure portal. Run a simple KQL query:
SecurityAlert | take 10.
This query will display the ten most recent alerts. Additionally, you can check the "Data received" graph on the connector page, which shows data ingestion activity over the past two weeks. If the connector status reads "disconnected", it indicates no data has been ingested in the last 14 days.
Once you’ve confirmed data ingestion, you’re ready to move on to configuring incident creation rules in the next step.
Step 2: Turn On Incident Creation Rules
Once data is flowing into Sentinel, the next step is to activate incident creation rules. These rules transform alerts into actionable incidents. By default, alerts populate the SecurityAlert table but don't convert into incidents automatically. You can enable incident creation through connector settings, pre-built rule templates, or by crafting custom rules.
The easiest way to get started is by heading back to your data connector page and ticking the box labelled "Create incidents – Recommended". For more tailored control over which alerts trigger incidents, go to Configuration > Analytics > Rule templates, filter by Microsoft security, and choose a template that corresponds with your alert source, such as Microsoft Defender for Endpoint or Defender for Identity. If you're juggling multiple security tools, you can create a custom rule by navigating to Configuration > Analytics > Create > Microsoft incident creation rule. This lets you manage alerts from several Microsoft security services under one rule, streamlining your setup.
Enable Default Incident Creation Rules
The default rule converts all alerts into incidents, but this can quickly lead to an overload of information. To reduce noise, refine the rule to convert only High or Medium severity alerts into incidents. This ensures your team focuses on the most pressing issues.
Adjust Rules for Severity and Source
To prevent your SOC (Security Operations Centre) from being swamped by low-priority alerts, adjust the rule to filter alerts based on severity. Opt for High or Medium severity alerts, leaving informational or low-severity alerts in the SecurityAlert table for potential use in threat hunting, without automatically escalating them to incidents.
You can also refine your rules further by filtering alerts based on their name using text-based conditions. For instance, if you want to exclude alerts tied to scheduled penetration tests, use the "Does not contain" operator with relevant keywords. Just be sure that if you create multiple rules for the same security service, the filters don’t overlap - this avoids generating duplicate incidents.
During rule creation, the Automated response tab offers additional options to trigger automation rules or playbooks as soon as an incident is generated. This could include automatically assigning incidents to specific analysts, tagging incidents by their source, or sending instant notifications via Microsoft Teams.
Once incident creation rules are set up, you’re ready to move on to Step 3 and configure automated response triggers.
Step 3: Automate Incident Handling with Rules
Once you’ve set up incident creation rules, the next step is to configure automation rules to take over incident handling. These rules streamline operations by automating repetitive tasks, allowing your SOC to focus on investigations. You can manage these rules from the Automation page under the Configuration menu, where they execute based on specific triggers.
Set Up Automation Rule Triggers
Automation rules can be triggered in three ways: When incident is created, When incident is updated, and When alert is created. For most SOC workflows, it’s best to rely on incident-based triggers since incidents act as "case files", consolidating alerts, entities, and comments. The "When incident is created" trigger is ideal for initial triage actions, such as assigning an owner or changing the incident’s status. Meanwhile, the "When incident is updated" trigger can handle follow-up actions, like notifying senior analysts if the severity level changes.
If you’re dealing with temporary scenarios, like maintenance, you can set an expiration date on rules to avoid suppressing legitimate incidents.
Define Conditions and Actions
Conditions help narrow down which incidents will activate a rule. These filters can be based on attributes like severity, status, tactics, or even custom data extracted from raw event logs. For more complex scenarios, you can use condition groups to apply "OR" logic, allowing a rule to trigger if any of several criteria are met. When using update triggers, the "Updated by" condition is essential to avoid triggering loops from rule-driven changes.
Actions make the automation process more efficient. You can assign incidents to specific analysts, adjust severity levels, tag incidents, or create task checklists to standardise triage workflows. If you want to run a playbook as part of the automation, ensure that Microsoft Sentinel has been granted Microsoft Sentinel Automation Contributor permissions for the resource group containing the playbook. Without these permissions, the playbook option will remain disabled.
Step 4: Set Up Notification Channels
Once your incident handling process is automated, it's crucial to ensure that alerts are delivered to the right people. Action groups are key here - they're collections of notification preferences and automated actions you can use across multiple alert rules. Each action group can link to up to five alert rules, and each rule can trigger as many as five action groups. This setup ensures your alerts are sent out reliably and efficiently.
Create Action Groups
To create an action group, head to the Azure portal and go to Monitor > Alerts > Action groups, then click Create. From there, configure your subscription and resource group, and set the region to Global if you're handling Service Health alerts. You'll also need to provide an Action group name and a Display name, which will appear in notification headers.
For notifying all members of a subscription role, use the Email Azure Resource Manager role option. This method is particularly effective as it automatically adjusts to changes in team memberships. However, keep in mind that it might take up to 24 hours for newly added users to start receiving notifications.
Once you've set up the action group, test it using the Test button to make sure alerts are being delivered properly. With this in place, you can move on to integrating communication tools for more direct notifications.
Connect Communication Tools
For platforms like Microsoft Teams or Slack that require specific formatting, use the Logic Apps action type to modify the alert payload before sending it. If you need stronger authentication, Secure Webhooks with Microsoft Entra ID are a good option. Webhook actions will retry delivery up to five times, with intervals of 5, 20, and 40 seconds, followed by another 5-second attempt. If all attempts fail, retries will pause for 15 minutes.
To prevent alert fatigue, Azure Monitor imposes rate limits on SMS, voice, and email notifications. However, programmatic actions like webhooks are not subject to these limits. Make sure to configure your email filters to allow messages from the following addresses:
azure-noreply@microsoft.comazureemail-noreply@microsoft.comalerts-noreply@mail.windowsazure.com
It's worth noting that activity log alerts, service health alerts, and resource health alerts are free of charge. However, SMS and voice notifications may incur standard rates depending on your region.
Step 5: Use Playbooks for Advanced Automation
Once you've set up alert delivery and automation rules, it's time to take things further with playbooks. These are designed to handle more intricate incident responses than basic notifications. Built using Azure Logic Apps, playbooks can enrich alerts with threat intelligence, integrate incidents with ticketing systems, or even perform automated remediation actions like isolating compromised devices.
Build and Configure Playbooks
Playbooks provide the tools for creating advanced response workflows. They can be triggered in several ways: automatically through automation rules, manually from the incidents view, or using entity-triggered templates. When setting up a playbook, you can choose between two types of Logic Apps:
- Consumption Plans: Operate on a pay-per-execution model, ideal for simpler or less frequent automations.
- Standard Plans: Offer fixed pricing and include features like VNet integration and private endpoint support, making them suitable for more demanding workflows.
Every playbook consists of a trigger, actions, and dynamic fields. To ensure reliability, use a Managed Identity for authentication, which helps prevent execution errors. If you're working with entity triggers, add a condition to check if the "Incident ARM ID" is null - this avoids failures during threat-hunting scenarios. Additionally, the "Parse JSON" action can be used to extract specific details from the "Alert custom details" array, enabling event-specific data to guide subsequent steps in the workflow.
Test Playbook Execution
Before linking a playbook to an automation rule, it's essential to test it. You can run the playbook manually from the "Incidents" or "Alerts" view, then review its performance in the "Runs history" section on the Logic App Overview page. This shows the status of each step and the data exchanged during execution.
Also, make sure the Microsoft Sentinel service account has the Microsoft Sentinel Automation Contributor role assigned to the resource group containing the playbooks. Without this permission, automated playbook execution will fail. If you're using Standard logic apps with private endpoints, define an access restriction policy to prevent situations where the playbook appears in Sentinel but cannot execute.
Verification and Testing
It's important to ensure that playbooks and automation rules are working as expected. The Azure portal includes a built-in "Test" feature specifically for action groups, allowing you to check notifications and automated actions. To use it, navigate to Monitor > Alerts > Action groups, select the action group you want to test, and click Test. You can then choose a sample alert type, like Metric or Log Search, to confirm that your Logic App or Webhook correctly processes the incoming JSON. These tests help connect your configurations to operational readiness, ensuring everything runs smoothly.
Test Incident Automation End-to-End
To test incident automation thoroughly, temporarily lower alert thresholds - for example, set CPU usage to trigger at values above 1% - so that alerts fire right away. Once triggered, review the alert rule's "History" to check the execution details. If you're working with Logic Apps, use the "Runs history" section in the Logic App Overview page to confirm that all steps executed correctly and that data flowed as expected.
Check Notification Delivery
Once the automation is verified, focus on ensuring notifications are delivered as intended. When a new recipient is added to an action group for email or SMS alerts, Azure automatically sends a confirmation message. If notifications aren't coming through, check the spam folder for emails from azure-noreply@microsoft.com or azureemail-noreply@microsoft.com. For notifications sent to Microsoft Teams or Slack via Logic Apps, enable the Common Alert Schema in the Action Group settings to ensure a standardised JSON payload. If delivery fails, use the "View details" option to access error codes and diagnostics.
Review Logs and Adjust Settings
Logs are invaluable for fine-tuning your settings and troubleshooting automation issues. The Activity Logs can show who created, updated, or deleted alert rules across your subscriptions. For more detailed analysis, route logs and metrics to a Log Analytics workspace via Diagnostic Settings, allowing for centralised monitoring and correlation. If an action group test fails or notifications stop unexpectedly, check for rate limiting - Azure Monitor enforces limits on SMS, voice, and email alerts to maintain system manageability. For webhook failures, Azure Monitor retries up to five times within 75 seconds, and if it still fails, it pauses for 15 minutes before attempting again.
Conclusion
Automating incident alerts in Azure using the outlined five steps can transform how SMBs handle incident response. With this approach, issues can be detected and resolved before users even notice, enabling quicker interventions compared to traditional monitoring methods.
Stateful alerts activate only once when conditions are met and won’t trigger again until resolved. This prevents unnecessary notifications and keeps attention on active incidents. Dynamic thresholds, powered by machine learning, minimise the need for constant manual adjustments. Meanwhile, automated remediation through action groups and playbooks allows for immediate fixes - like restarting a virtual machine or scaling resources - simplifying the entire incident management process. In Microsoft Sentinel, automation rules further streamline operations by assigning incident owners, updating statuses, and tagging incidents for classification, making small security teams more efficient. This centralised system also aids in governance and cost control, which is crucial for SMBs with limited cloud resources.
On top of improving operational efficiency, these automation techniques bolster security. By using managed identities, the risk of credential theft is reduced since secret management is no longer required. Baseline monitoring can be implemented without extra costs, while historical incidents remain accessible for analysis and improvement.
This strategy not only sharpens your team’s focus on critical threats but also ensures cost-effective, streamlined operations. It’s a smart way to maintain a strong security stance while staying within budget.
FAQs
How can I check if data is being sent correctly to Microsoft Sentinel?
To ensure data is being sent correctly to Microsoft Sentinel, begin by checking the setup of your data collection rules. Make sure all data source connections are active and configured properly. Using Azure's Data Collection Rules gives you the tools to define, manage, and troubleshoot these sources with ease.
Keep an eye on the health of your connections and regularly review incoming logs. This helps confirm that the data matches what you expect. Staying proactive in this way ensures smooth operations and accurate detection of incidents.
What are the advantages of using playbooks for managing incidents in Azure?
Using playbooks for incident management in Azure offers several practical benefits. They automate routine tasks, which means security incidents can be addressed more quickly and consistently. This not only speeds up response times but also frees up your team to work on higher-priority, strategic initiatives.
Playbooks also help simplify workflows, boosting the efficiency of your security operations. By reducing the chance of human error, they ensure incidents are managed promptly and with precision, contributing to a more reliable and secure system overall.
How can I reduce alert fatigue when using Azure's notification tools?
To cut down on alert fatigue in Azure, start by fine-tuning your alert rules so only the most critical issues trigger notifications. Schedule alerts to be suppressed during planned maintenance to prevent unnecessary disruptions. Leverage tools like action groups and logic apps to tailor and streamline how notifications are sent - whether that’s through email, Microsoft Teams, or other channels. By focusing on what’s relevant and managing delivery channels wisely, you can stay attentive to the issues that truly need your attention.